 Last night I had an interesting discussion with Aaron on the topic of ‘Usability Magnitude Estimation’ where we discussed the various capabilities of this very scientific and powerful tool that elicits a user’s perception of a product. Mick and Aaron have successfully applied this methodology on various software applications, devices and even the BART public transit system in the Bay Area.
Coming from Motorola and having seen the challenges of the mobile device industry from close quarters, I’m writing down my perspective on applying UME to the building of an effective portfolio.
To give some background on UME: Usability Magnitude Estimation is a methodology used by us to measure the value of the user’s perception of expected and actual user experience. This is a powerful tool that can be effectively used to improve many product capabilities and hence company portfolios.
A telecom service provider portfolio mainly consists of products (cell phones) and services. Let us consider the products aspect of the portfolio and apply UME:
A portfolio is mainly divided based on segmentation and price point. A cell phone has physical and digital attributes that contribute to the overall experience delivered. (physical color, finish, keypad usability, density, one handed opening for clams, digital power up/down screen, individual applications, tasks within individual applications, especially high ARPU tasks, graphical elements etc.)
A portfolio manager’s task is to define the segmentation and price point based on consumer insights and then get products that deliver the desired experience. My past experience with Motorola has shown that it is often the most difficult task to make these picks, with availability and sourcing prices the normal driving factors.
I will talk about 3 ways that the UME methodology when applied to mobile phones can help in building an effective portfolio and also in creating the roadmap for technology and vendors
1. ‘Experience Values’ of individual product attributes:
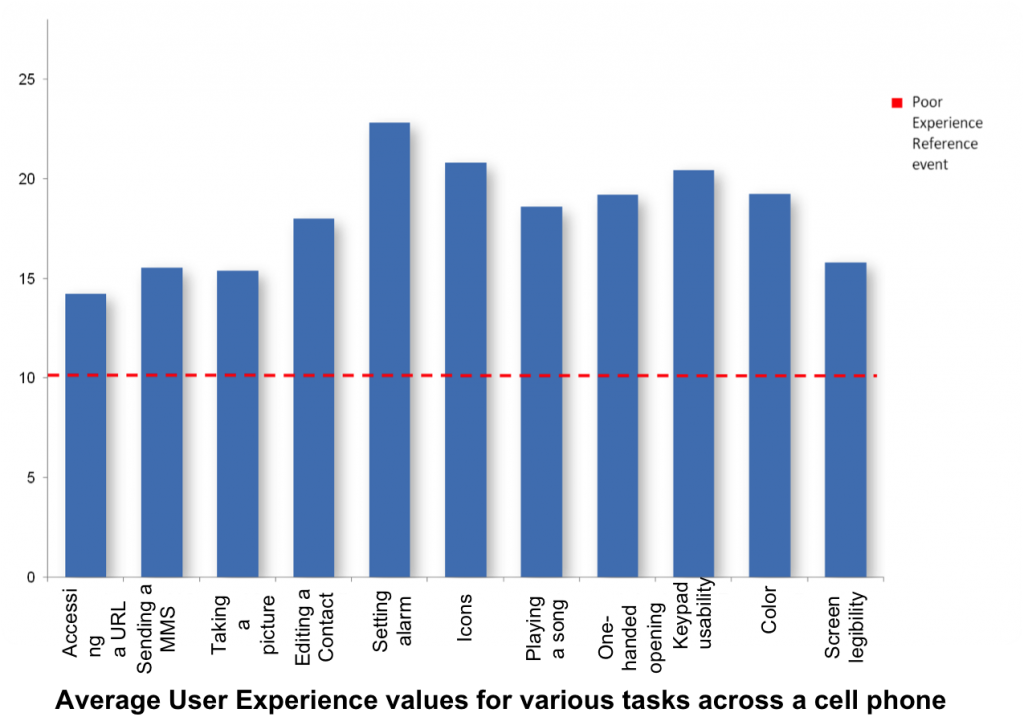
As part of the UME method, users representing various user groups can be tested on specific attributes of a mobile phone (physical and digital). The results of this particular procedure helps give ‘Experience Values’ which tells us how users perceive and rate each attribute. These values are normalized across users and can be compared between the specific attributes. For example, the results can tell us if the user thinks ‘Internet Browsing’ is a better user experience than ‘attaching a picture to a MMS message’, and by how much. (i.e. Internet browsing has a 20% better user experience than attaching a picture.). The qualitative part of the study gives specific inputs into the reasons behind the results, which can then be used to improve the experience of the various tasks.
The figure below shows the comparative Experience Values across the various attributes of a cell phone. It helps compare different and non-similar aspects of a cell phone across a common reference line.

2. User experience expectations (Perceived vs Actual)
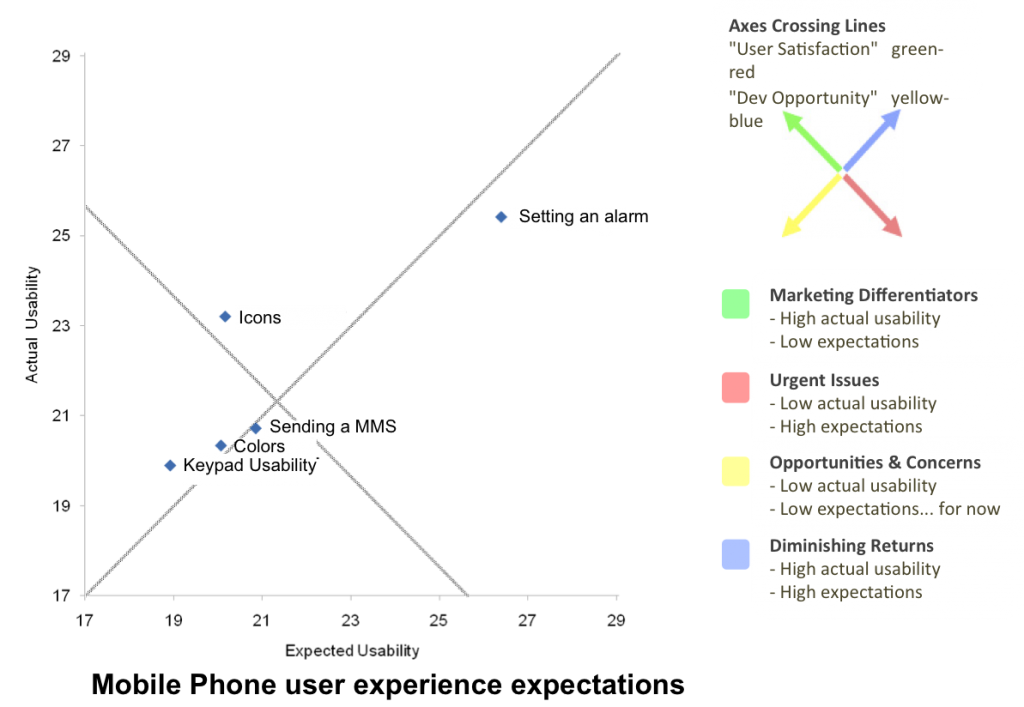
The analysis of the expected vs. actual experience when performing the selected tasks gives an insight into tasks that meet users expectations, were below expectations and above expectations. These results are plotted by a scaled average expected vs. actual user experience per event. The diagonal line (from bottom left to top right) represents where expectations are exactly met. Events above the line are exceeding expectations and events below the line are below expectations of user experience. For example, the figure below shows the ‘Setting of an alarm’ experience to be above users’ expectations (on average), while sending an MMS appears to exactly meet expectations. This chart helps identify areas of design that need improvement and also areas, which can be marketed as being a great user experiences. It is also interesting to note that some things have low expectations, and their actual user experience matched the low expectations. Such cases are highlighted since any improvements will exceed user expectations and if done right could really help improve satisfaction overall.

3. Benchmarking against competitor products
UME allows us to compare the overall experience of the desired product with competitor products. This can also be done at an individual task level or by entire products. This helps set expectations and set priority for roadmaps and feature definition. The figure below shows the overall experience values obtained when cell phone A was compared against Cell Phones B, C, D and E.

So, one can see from the above that UME can be a very powerful and handy tool to quantitatively asses a product portfolio and evolve it over time to make its experience as desired by consumers.